Builds a forest plot from standardized coefficient data or directly from a fitted model.
Usage
ggforestplot(
  data,
  term = "term",
  estimate = "estimate",
  conf.low = "conf.low",
  conf.high = "conf.high",
  label = term,
  term_labels = NULL,
  group = NULL,
  facet = NULL,
  facet_strip_position = c("left", "right"),
  grouping = NULL,
  grouping_strip_position = NULL,
  separate_groups = NULL,
  n = NULL,
  events = NULL,
  p.value = NULL,
  exponentiate = NULL,
  sort_terms = c("none", "descending", "ascending"),
  point_size = 2.3,
  point_shape = 19,
  linewidth = 0.5,
  line_size = NULL,
  staple_width = 0.2,
  ci_limits = NULL,
  ci_arrows = TRUE,
  ci_arrow_length = 0.08,
  ci_arrow_type = c("closed", "open"),
  dodge_width = 0.6,
  separate_lines = FALSE,
  separator_line_linetype = 2,
  separator_line_colour = "black",
  separator_line_size = 0.4,
  striped_rows = FALSE,
  stripe_fill = "grey95",
  stripe_colour = NA,
  stripe_alpha = 1,
  ref_line = NULL,
  ref_label = NULL,
  ref_linetype = 2,
  ref_color = "grey60"
)
Arguments
- data
Either a tidy coefficient data frame or a model object supported by
broom::tidy().- term
Column name holding the model term identifiers.
- estimate
Column name holding the point estimates.
- conf.low
Column name holding the lower confidence bounds.
- conf.high
Column name holding the upper confidence bounds.
- label
Optional column name used for the displayed row labels.
- term_labels
Optional named vector used to relabel displayed terms. Names should match values in the term column and values are the labels to display.
- group
Optional column name used for color-grouping estimates.
- facet
Optional column name used to split rows into faceted plot sections. If this column is a factor, its levels control facet order.
- facet_strip_position
Positioning for facet strip labels.
- grouping
Deprecated. Use
facetinstead.- grouping_strip_position
Deprecated. Use
facet_strip_positioninstead.- separate_groups
Optional column name used to identify labeled variable blocks that can be outlined with grid lines.
- n
Optional column name holding sample sizes or other N labels for table helpers.
- events
Optional column name holding event counts or event labels for table helpers.
- p.value
Optional column name holding p-values.
- exponentiate
Logical; if
TRUE, transform the estimates and draw the axis on the log scale with the reference line at 1. For model objects,NULLuses the canonical scale when it can be inferred, such as hazard ratios for Cox models.- sort_terms
How to sort rows:
"none","descending", or"ascending".- point_size
Point size for coefficient markers.
- point_shape
Shape used for coefficient markers.
- linewidth
Line width for confidence intervals.
- line_size
Deprecated. Use
linewidthinstead.- staple_width
Width of the terminal staples on confidence interval lines.
- ci_limits
Optional numeric vector of length 2 used to truncate displayed confidence intervals. Intervals extending beyond these limits are clipped to the boundary and marked with arrows when
ci_arrowsisTRUE.- ci_arrows
Logical; if
TRUE, draw outward-facing arrows for confidence intervals truncated byci_limits.- ci_arrow_length
Length of CI truncation arrows in inches.
- ci_arrow_type
Arrowhead type for truncated confidence intervals. Passed to
grid::arrow().- dodge_width
Horizontal dodging used for grouped estimates.
- separate_lines
Logical; if
TRUE, draw grid lines around each labeled block identified byseparate_groups.- separator_line_linetype
Line type used for separator lines.
- separator_line_colour
Colour used for separator lines.
- separator_line_size
Line width used for separator lines.
- striped_rows
Logical; if
TRUE, shade alternating rows.- stripe_fill
Fill color used for shaded rows.
- stripe_colour
Border color for shaded rows.
- stripe_alpha
Transparency for shaded rows.
- ref_line
Numeric x-value where the reference line is drawn, or
NULLto hide it. When omitted, defaults to0for additive effects and1for exponentiated effects.- ref_label
Optional label drawn alongside the reference line.
- ref_linetype
Line type for the reference line.
- ref_color
Color for the reference line.
Value
A ggplot object. Use standard ggplot2 functions such as
ggplot2::labs() for plot labels, and add composition helpers after
styling the main plot.
Examples
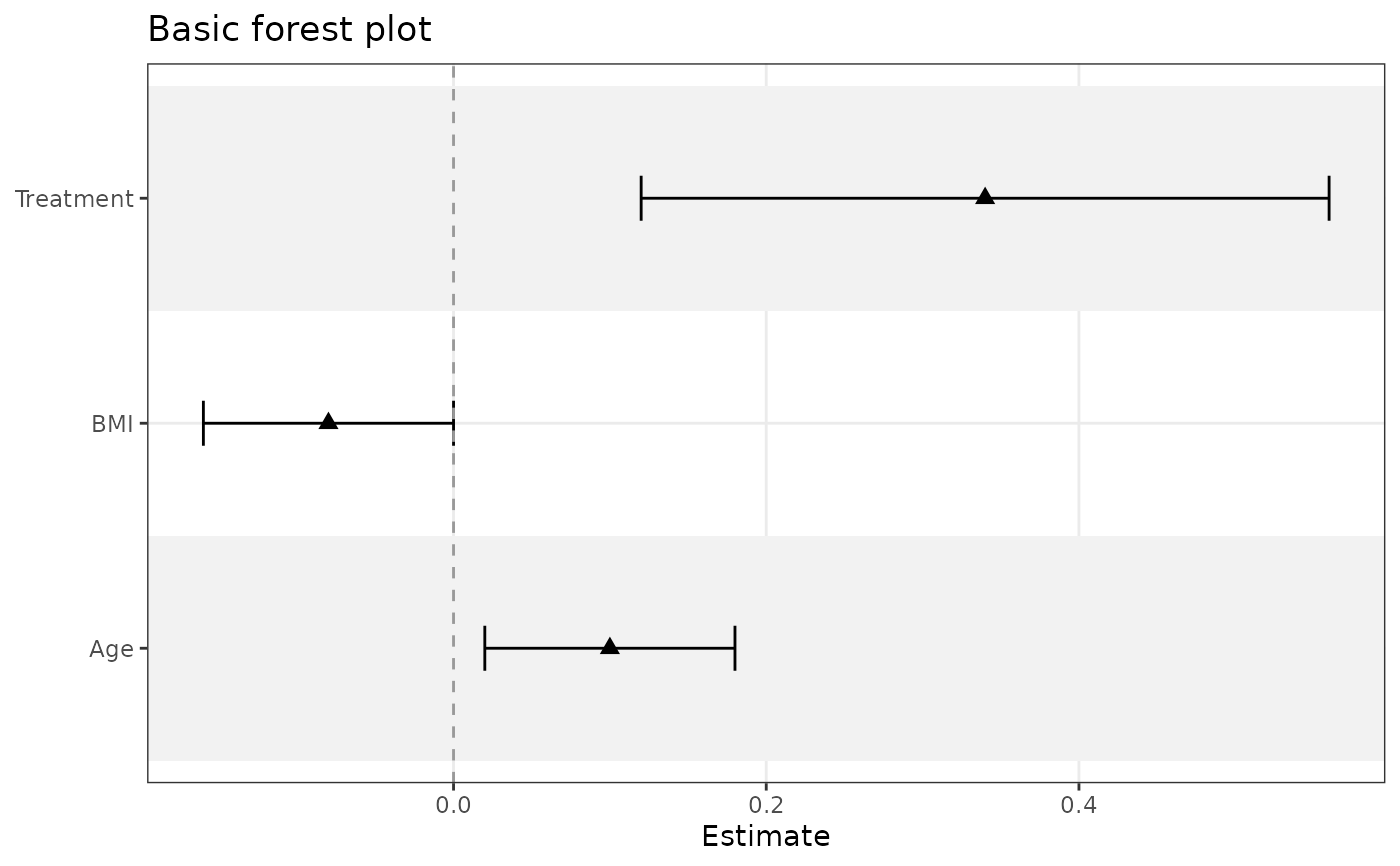
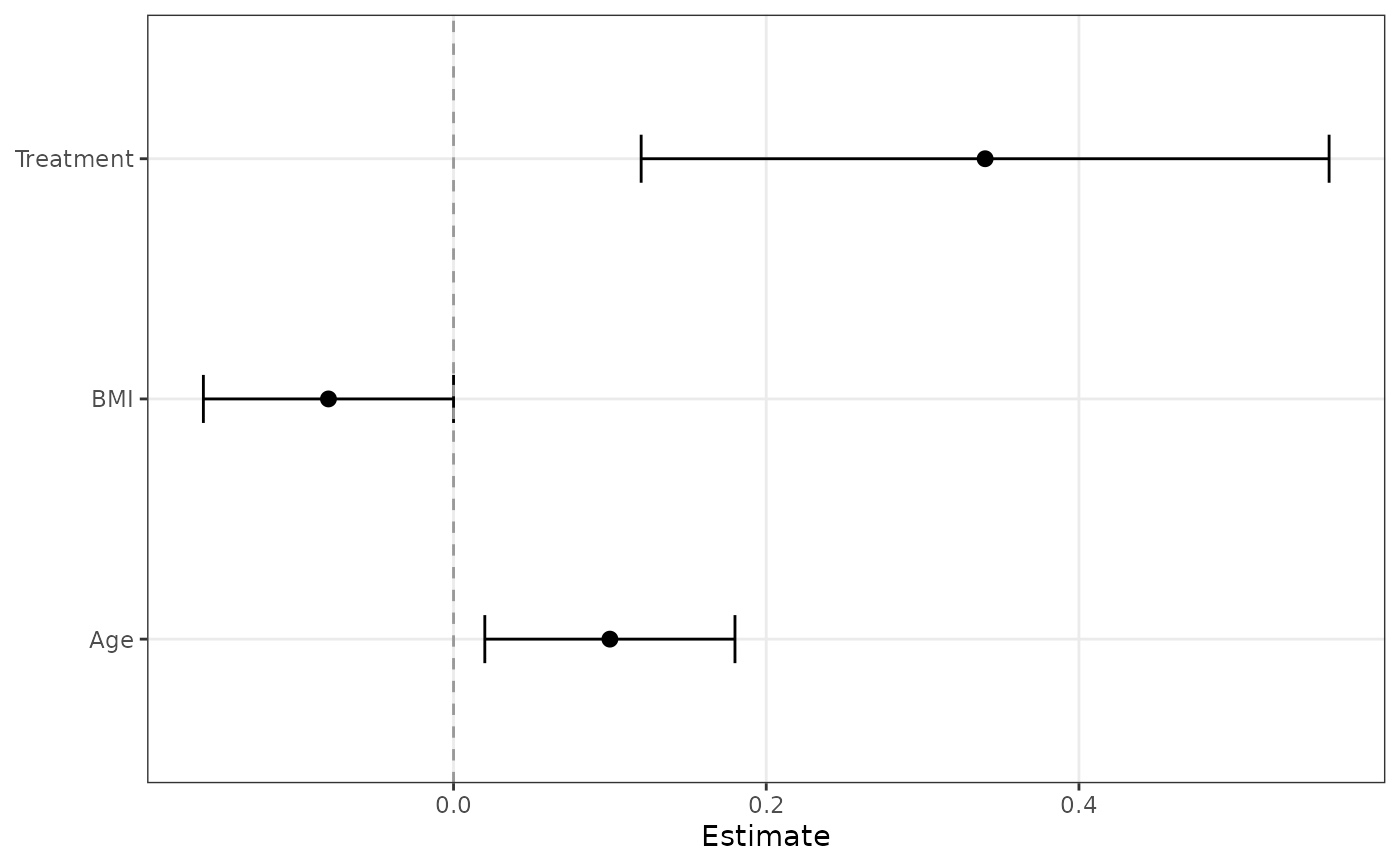
coefs <- data.frame(
  term = c("Age", "BMI", "Treatment"),
  estimate = c(0.10, -0.08, 0.34),
  conf.low = c(0.02, -0.16, 0.12),
  conf.high = c(0.18, 0.00, 0.56)
)

ggforestplot(coefs)


ggforestplot(coefs, striped_rows = TRUE, point_shape = 17)