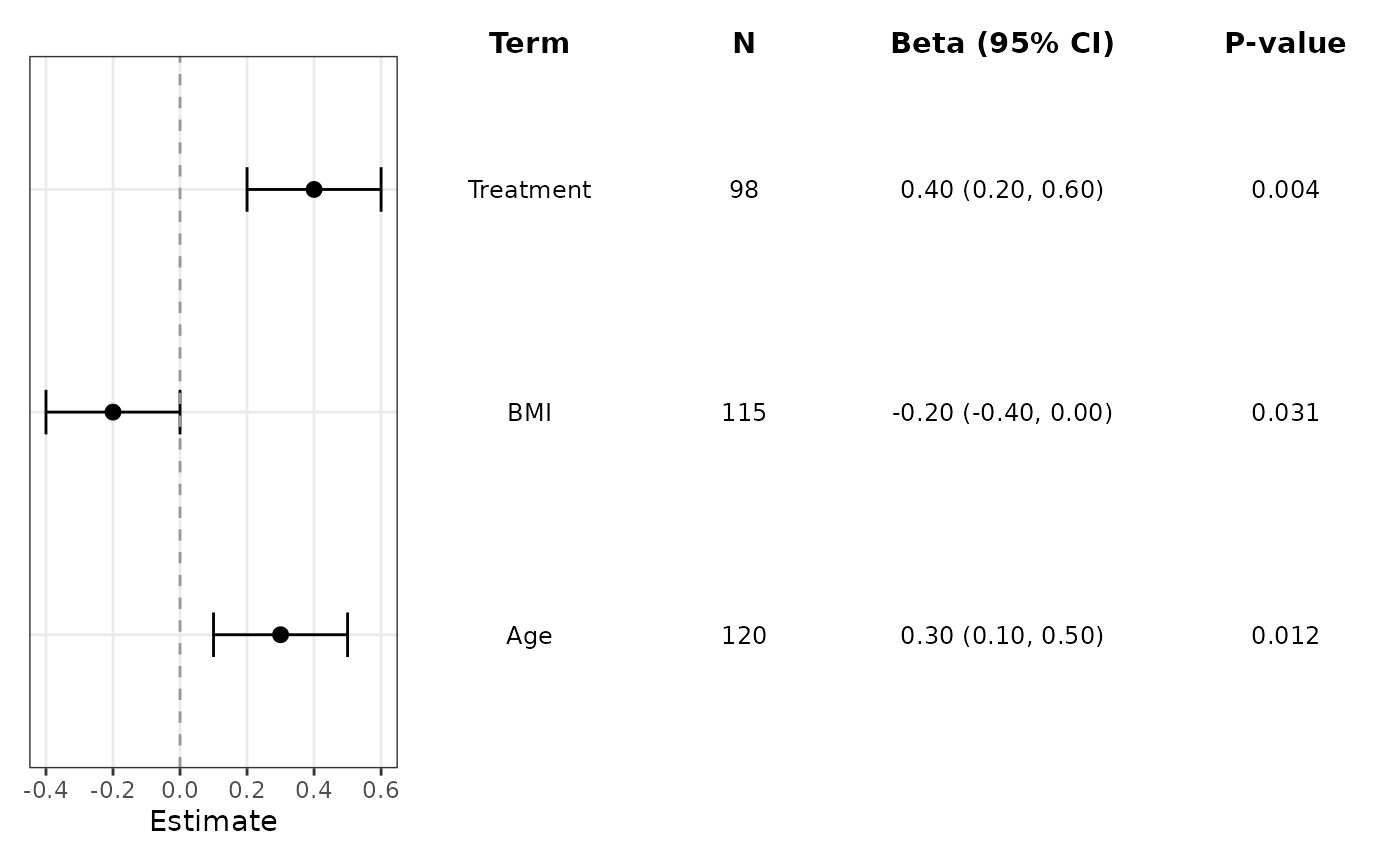
Compose a summary table onto a forest plot.
Usage
add_forest_table(
  plot = NULL,
  position = c("left", "right"),
  columns = NULL,
  term_header = "Term",
  n_header = "N",
  events_header = "Events",
  estimate_label = NULL,
  p_header = "P-value",
  column_labels = NULL,
  digits = NULL,
  estimate_digits = NULL,
  interval_digits = NULL,
  p_digits = NULL,
  estimate_fmt = NULL,
  ci_fmt = NULL,
  text_size = NULL,
  header_text_size = NULL,
  header_fontface = "bold",
  header_family = NULL,
  striped_rows = NULL,
  stripe_fill = NULL,
  stripe_colour = NULL,
  stripe_alpha = NULL,
  grid_lines = FALSE,
  grid_line_colour = "black",
  grid_line_size = 0.3,
  grid_line_linetype = 1
)
Arguments
- plot
A plot created by
ggforestplot(). Leave asNULLto use+ add_forest_table(...)syntax.- position
Whether to place the table on the left or right of the forest plot.
- columns
Optional explicit columns to display in the side table, in the order they should appear. Accepts built-in names such as
"term","n","events","estimate","ci", and"p", arbitrary original dataframe columns, or numeric positions in the supplied data."conf.low"and"conf.high"are accepted as aliases for"ci".- term_header
Header text for the term column.
- n_header
Header text for the
Ncolumn.- events_header
Header text for the
Eventscolumn.- estimate_label
Header label for the estimate column. Defaults to the model-derived label when available.
- p_header
Header text for the p-value column.
- column_labels
Optional named vector used to relabel table column headers. Names should match values supplied to
columnsafter column resolution, such as"term","estimate","ci","p", or an arbitrary original dataframe column.- digits
Deprecated. Number of digits used when formatting estimates and p-values. Defaults to
2. Useestimate_digits,interval_digits, andp_digitsfor separate control.- estimate_digits
Number of digits used for point estimates.
- interval_digits
Number of digits used for confidence interval bounds.
- p_digits
Number of digits used for p-values.
- estimate_fmt
Format string for the estimate column. Use
{estimate},{conf.low}, and{conf.high}as placeholders. The shorthand{conf.low, conf.high}is also supported. Defaults to"{estimate} ({conf.low}, {conf.high})", or"{estimate}"whencolumnsincludes"ci".- ci_fmt
Format string for the confidence interval column when
columnsincludes"ci". Use{conf.low}and{conf.high}as placeholders. The shorthand{conf.low, conf.high}is also supported. Defaults to"({conf.low}, {conf.high})".- text_size
Text size for table contents. Defaults to
3.2.- header_text_size
Header text size for table column labels. Defaults to
11.- header_fontface
Font face used for table column labels. Defaults to
"bold".- header_family
Optional font family used for table column labels.
- striped_rows
Whether to draw alternating row stripes behind the table. Defaults to the stripe setting used in
ggforestplot().- stripe_fill
Fill colour used for striped rows. Defaults to the stripe fill used in
ggforestplot().- stripe_colour
Outline colour for striped rows. Defaults to the stripe outline used in
ggforestplot().- stripe_alpha
Transparency for striped rows. Defaults to the stripe alpha used in
ggforestplot().- grid_lines
Whether to draw black horizontal grid lines in the table.
- grid_line_colour
Colour used for the table grid lines.
- grid_line_size
Line width used for the table grid lines.
- grid_line_linetype
Line type used for the table grid lines.
Value
A patchwork-composed plot containing the forest plot and side
table, or a ggplot add-on object when plot = NULL.
Examples
coefs <- data.frame(
term = c("Age", "BMI", "Treatment"),
estimate = c(0.3, -0.2, 0.4),
conf.low = c(0.1, -0.4, 0.2),
conf.high = c(0.5, 0.0, 0.6),
sample_size = c(120, 115, 98),
p_value = c(0.012, 0.031, 0.004)
)
p <- ggforestplot(coefs, n = "sample_size", p.value = "p_value")
add_forest_table(
p,
position = "left",
columns = c("term", "n", "estimate", "p"),
estimate_label = "Beta"
)
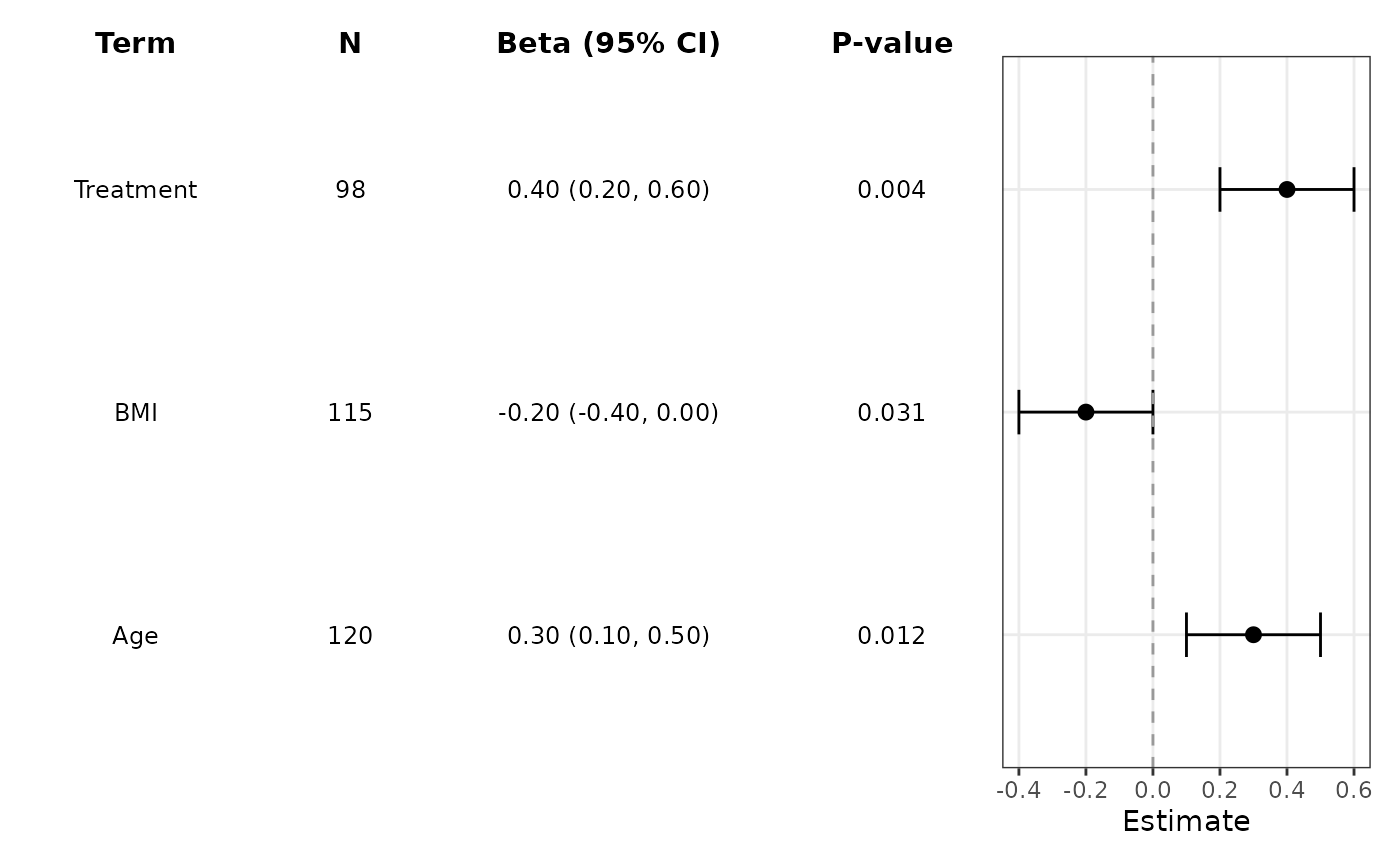 ggforestplot(coefs, n = "sample_size", p.value = "p_value") +
add_forest_table(
position = "right",
columns = c("term", "n", "estimate", "p"),
estimate_label = "Beta"
)
ggforestplot(coefs, n = "sample_size", p.value = "p_value") +
add_forest_table(
position = "right",
columns = c("term", "n", "estimate", "p"),
estimate_label = "Beta"
)