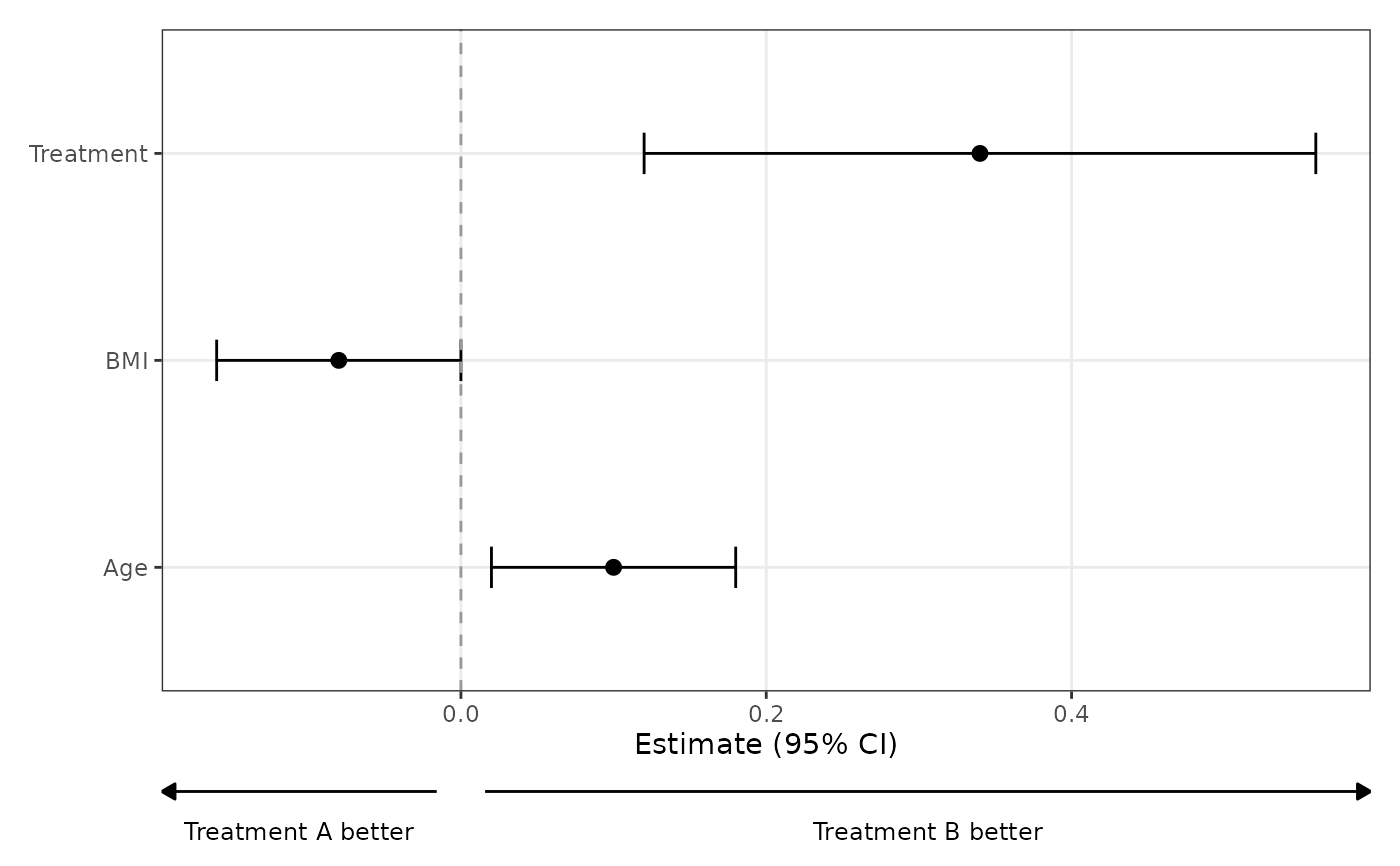
Compose a two-sided arrow annotation beneath the trained forest-plot x panel. The annotation is a separate footer plot, so it does not alter the forest plot's scales, limits, confidence intervals, or reference line.
Usage
add_favors(
  plot = NULL,
  left,
  right,
  reference = NULL,
  gap = 0.02,
  footer_height = 0.4,
  text_size = 3.2,
  linewidth = 0.5,
  arrow_length = 0.08,
  arrow_type = c("closed", "open")
)
Arguments
- plot
A plot created by
ggforestplot()or a supported forest-table composition. Leave asNULLto use+ add_favors(...)syntax.- left, right
Single strings shown beneath the left and right arrows.
- reference
Optional numeric reference value.
NULLuses the reference line resolved byggforestplot(), falling back to the null value stored in the forest-data metadata.- gap
Gap on each side of the trained reference position, expressed as a fraction of the forest panel width.
Footer height in inches.
- text_size
Text size passed to
ggplot2::geom_text().- linewidth
Line width passed to
ggplot2::geom_segment().- arrow_length
Arrowhead length in inches.
- arrow_type
Whether arrowheads are
"closed"or"open".
Value
A patchwork-composed plot with a footer beneath only the forest-plot
column, or a ggplot add-on object when plot = NULL.
Details
add_favors() is designed as the final composition step. It works with a
bare ggforestplot() result and with layouts returned by
add_forest_table() and add_split_table().
Examples
coefs <- data.frame(
term = c("Age", "BMI", "Treatment"),
estimate = c(0.10, -0.08, 0.34),
conf.low = c(0.02, -0.16, 0.12),
conf.high = c(0.18, 0.00, 0.56)
)
ggforestplot(coefs) +
add_favors(
left = "Treatment A better",
right = "Treatment B better"
)
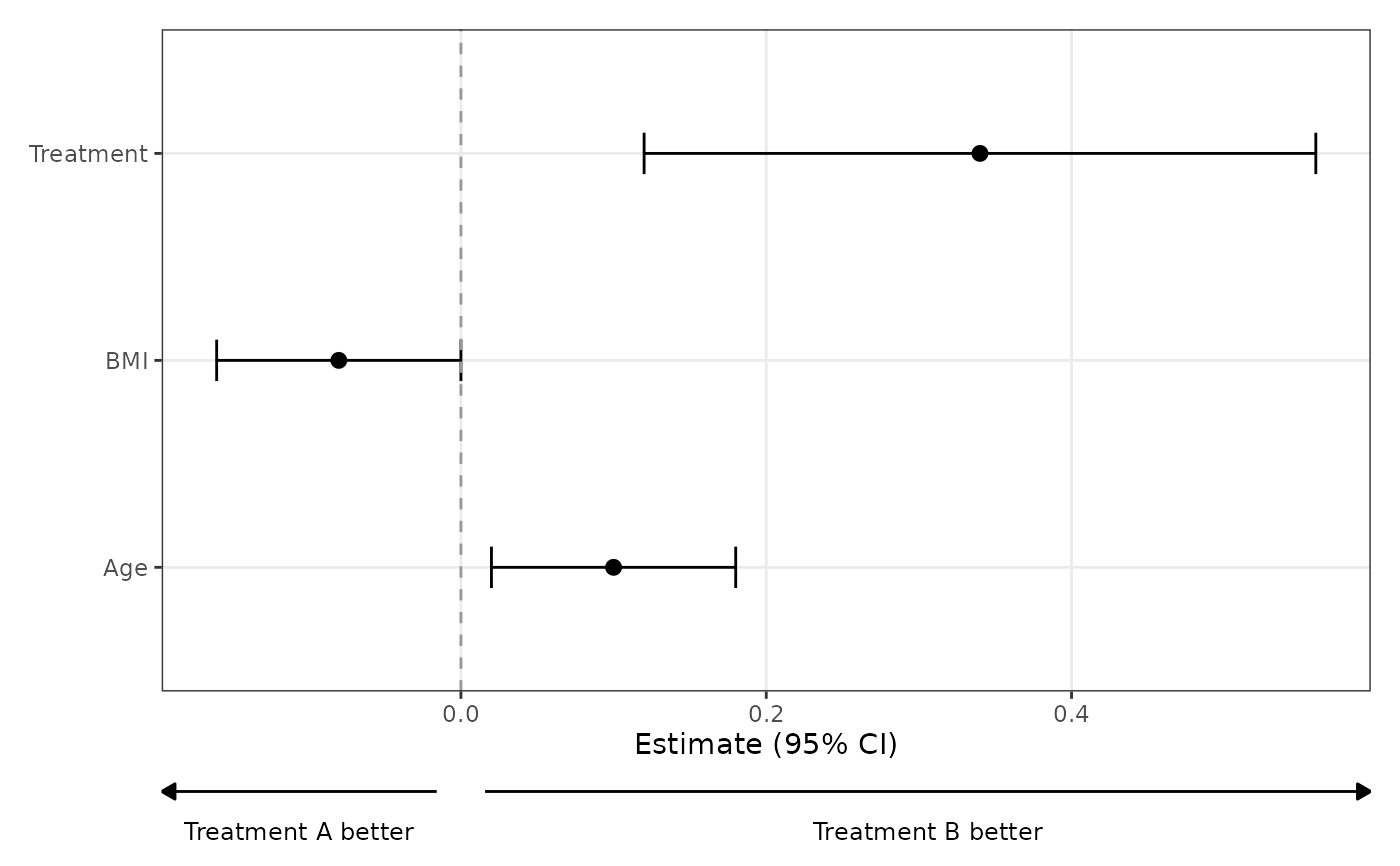 add_favors(
ggforestplot(coefs),
left = "Treatment A better",
right = "Treatment B better"
)
add_favors(
ggforestplot(coefs),
left = "Treatment A better",
right = "Treatment B better"
)